
IELTS Writing Task-1
4th Oct 2019
IELTS Writing Task 1 Academic requires you to write a summary or report in response to the question.
You will be given with one or more graph(s) (i.e. bar, column, line or pie), table, flowchart, map or process diagram.
You need to summarize the main information, make comparison of data, show differences and trends, identify significant trends and describe a process.
You should write between 150 to 200 words and the minimum word requirement is 150.
It is suggested that you spend 20 minutes on IELTS writing task 1 but the faster you can complete task-1, the more time you will have for writing task 2.
Always present factual data based on the diagram presented, and never assume something, even if this is a common knowledge.
Write in a way so that the examiner can very easily follow the trends of the graph and understand the factual information regarding the diagram.
IELTS Writing Task 1 Academic
Here is some valuable information on how to write task 1 academic:
It is suggested that you spend 20 minutes on writing task 1, however you can spend time on task 1 according to your plan.
As mentioned before, writing at least 150 words is a must and you will not be penalized for writing more.
IELTS writing task 1 accounts for 33% of your total writing marks.
The assessment criteria for writing task-1 are:
- Task Achievement (25%)
- Coherence and Cohesion (25%)
- Vocabulary (25%)
- Grammatical range and accuracy (25%)
That is, there are equal weights for each of the criteria.
Following are two examples of IELTS writing task-1
Bar Graph
A bar graph (also known as the bar chart) is a graph that contains either horizontal or vertical bars to present data comparison or contrast among categories or variables.
In your IELTS Academic writing task 1, you might get a bar graph that will have numerical values of different variables shown by the length and height of lines or rectangular shapes or equal width.
This bar graph will show the quantitative comparison of various data or categories and you are expected to write a report or summary of the diagram.
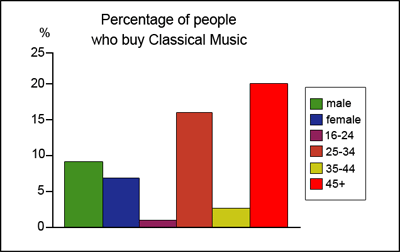
Illustration 1: Bar Graph
Line Graph
A line graph (also known as line chart) is a graphical presentation of data that changes over time.
It uses line segments to connect data points and shows changes in data. The X and Y axis are used to denote the changes in the data.
Within a line graph, there are points which are connected to show the changes in value.
While the title of the line graph shows the general overview of the data, the X-axis presents the occurrences and categories being compared and finally, the Y-axis shows the scale, which is a set of number that presents.
The scale/number in Y-axis is organized in an equal interval to present the data more visually.
Line graphs are quite versatile and it is an extensively used family of graphs. Line graphs are quite common in the Academic IELTS test.
If you are planning to take the IELTS exam, you must understand how to write a report or a summary based on a given line graph.
A line graph can contain one of the multiple lines to show changes over time and comparison among different items.
A single line is comparatively easier to describe and with the increase of the line number, it can become quite complex sometimes.
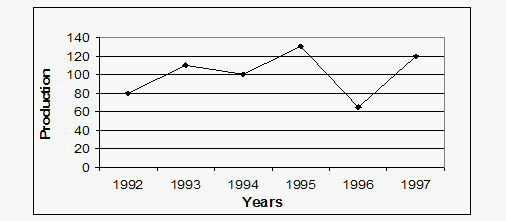
Illustration 2: Chart Graph
At IELTS.live you will find writing test for both writing task 1 and writing task 2 which will be assessed by our expert IELTS team.
For IELTS writing online assessment, just click on:


Comments:
Post a comment on "IELTS Writing Task-1"
Showing 1 Comments
Samia